Cyclone System
System Design and Principles of Operation
The Cyclone System operates as a longer term daytrading
system by calculating proprietary support and resistance
points using data inputs from the last several trading
sessions.
The primary focus of the system are two pivot lines,
one of which is drawn above yesterday's close, the
other being drawn below the close of
yesterday.These are pivotal areas for the market for
the day in question. When the market reaches these
points they can often be a turning
point for the trend for that day.
Entry Signals
No trades are entered during the first 45 minutes
of the day or during the last 45 minutes of the day.
Let's first consider a day in which the market trades
higher from the open and then encounters the upper
green pivot line.
From this point, two trades are possible for the
system, a breakout trade and a counter trend trade.
If the market continues trading higher, a breakout
trade will be entered at the upper yellow line.
If the market respects the calculated resistance at
the green line and turn lower, a counter trending
short position will be entered at the red line below
the upper green line.
In this fashion the system will take advantage of
the trend which develops after the market encounters
significant resistance. If the market is indeed a
stong one for the day the system will get on board
the uptrend with a buy stop at the upper yellow line.
If the market respects the resistance the system will
enter a short position with anticipation that the
market has made its high for the dayand will trend
lower for the remainder of the day.
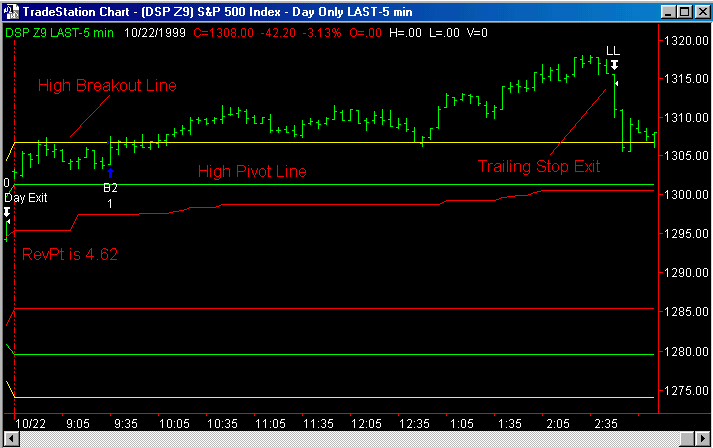
The chart below illustrates a high breakout trade.
The automatic trailing stop programmed into the system
is responsible for the exit of this trade.

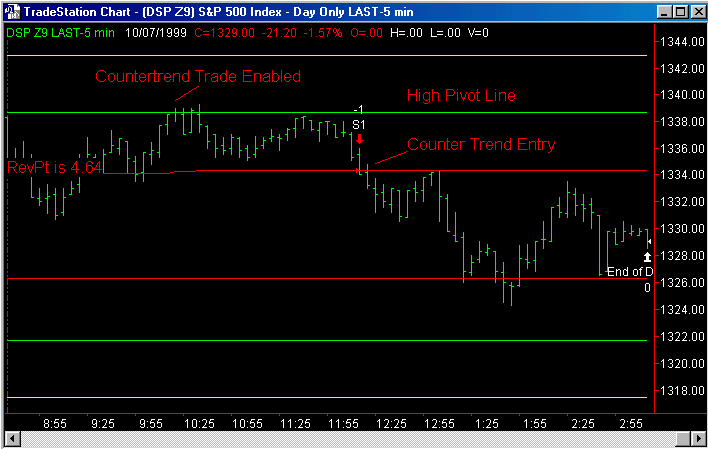
The chart below shows a countertrend
day. The trade is enabled by the market challenging
resistance at the green high pivot line, failing to
move higher, and then trending lower for the rest
of the day. The trade is exited at the end of the
day.

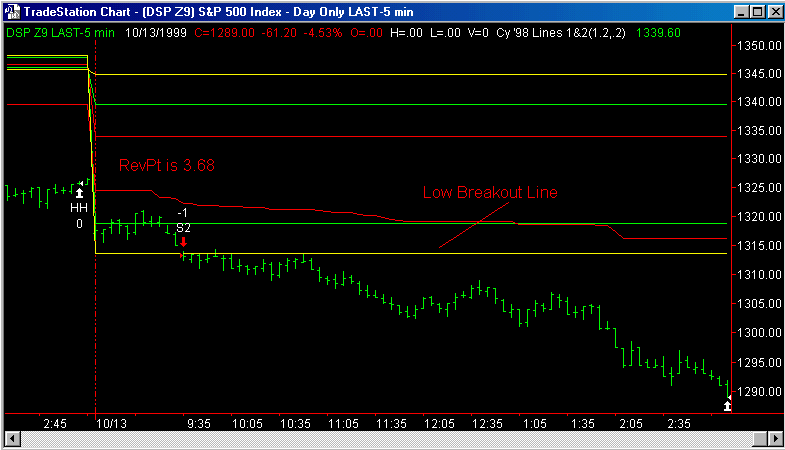
The same conditions will set
up a breakout trade on the lower side of the market.
The chart below illustrates such a trade.
The trade is entered when the market breaks the lower
breakout line. We exit the trade appriximately 24
points lower at the end of the trading day.

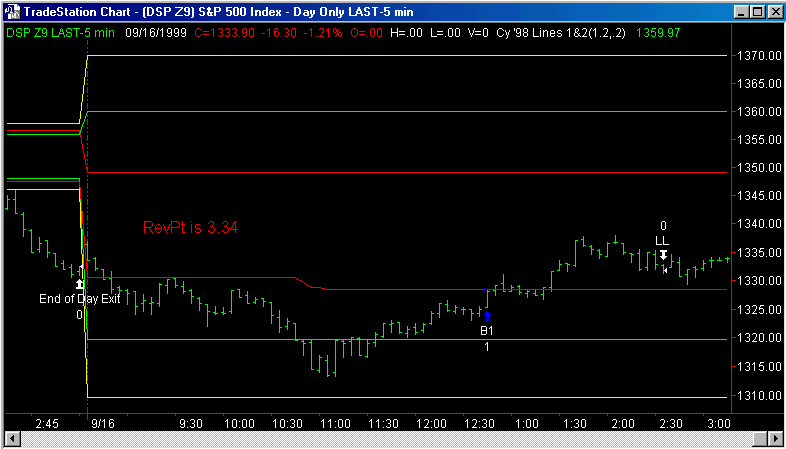
The next chart illustrates
the countertrend trade that develops when the market
finds support at the lower pivot line and trends higher
for the rest of the day.


